

In the past few months, I started a deep dive into recruiting metrics. My real job was preventing me from putting it all together. Well, now that my entire industry has been sent home, and for the first time since my first job when I was 14 years old – I have A LOT of free time. I was able to complete my data compilation and start putting together some things to look at with you.
The basis is of my analysis is similar to Budd Elliot’s Blue Chip metric. Here is my the data that I collected for the analysis.
- Collect 247 Sports Composite Recruiting Rankings for the Top 1,200 recruits starting with the 2010 class (14,732 players)
- Each Roster, per CFB Stats from all Final Playoff Committee Top 25 (before playoff) and Power 5 Conferences (54,106 players)
- Averaged each year’s rostered 247 Composite rated players
- Totaled each year’s rostered 247 Composite rated players
- Charted Offensive Yards Per Play (OYPP)
- Charted Defensive Yards Per Play Allowed (DYPA)
- Charted OYPP minus DYPA (YPP Differential)
Another basis for this analysis that getting IN THE PLAYOFF is the most important accomplishment for a team. Of course, it goes without saying WINING the CFP is the ultimate goal, but getting selected is the most important step. To be selected, you are competing against the entirety of college FBS teams. This will draw lines from how well a team recruits- to performance (and underperformance) on the field -to be selected as one of the four teams selected by the CFP committee.
There is not a single qualification that guarantees one the four playoff spots. Recruiting doesn’t guarantee it. 2015 USC has the highest 247 Composite Average by a team not named Alabama or Ohio State only to be ranked 25th by CFP Committee. LSU’s 2018 and 2015 rosters were quality enough to be in the playoff. UGA’s 2018 and 2019 rosters were better than the 2017 playoff team. 2019 Alabama is the highest quality roster in the playoff era (and had the highest YPP differential in Playoff era) Yet, none of them were selected
Winning or not winning your Conference Championship doesn’t qualify you. Alabama, most notably in 2017 and Notre Dame didn’t have to win a conference title. The Committee, by nature of a 4 team playoff, has to leave at least on conference champ out of the playoff. That said, in all six years, the SEC Conference Champion has been selected by the committee. Certainly, no single or multiple metric will land a team a spot. Though, this piece may layout a strong indicator of what might land a team in the playoff.
OK, let’s go! This first chart is the average player rating for CFP ranked teams. This an average of each team ranked at their CFP ranking. This only averages the players on the rosters that were in the top 1,200 of their class.
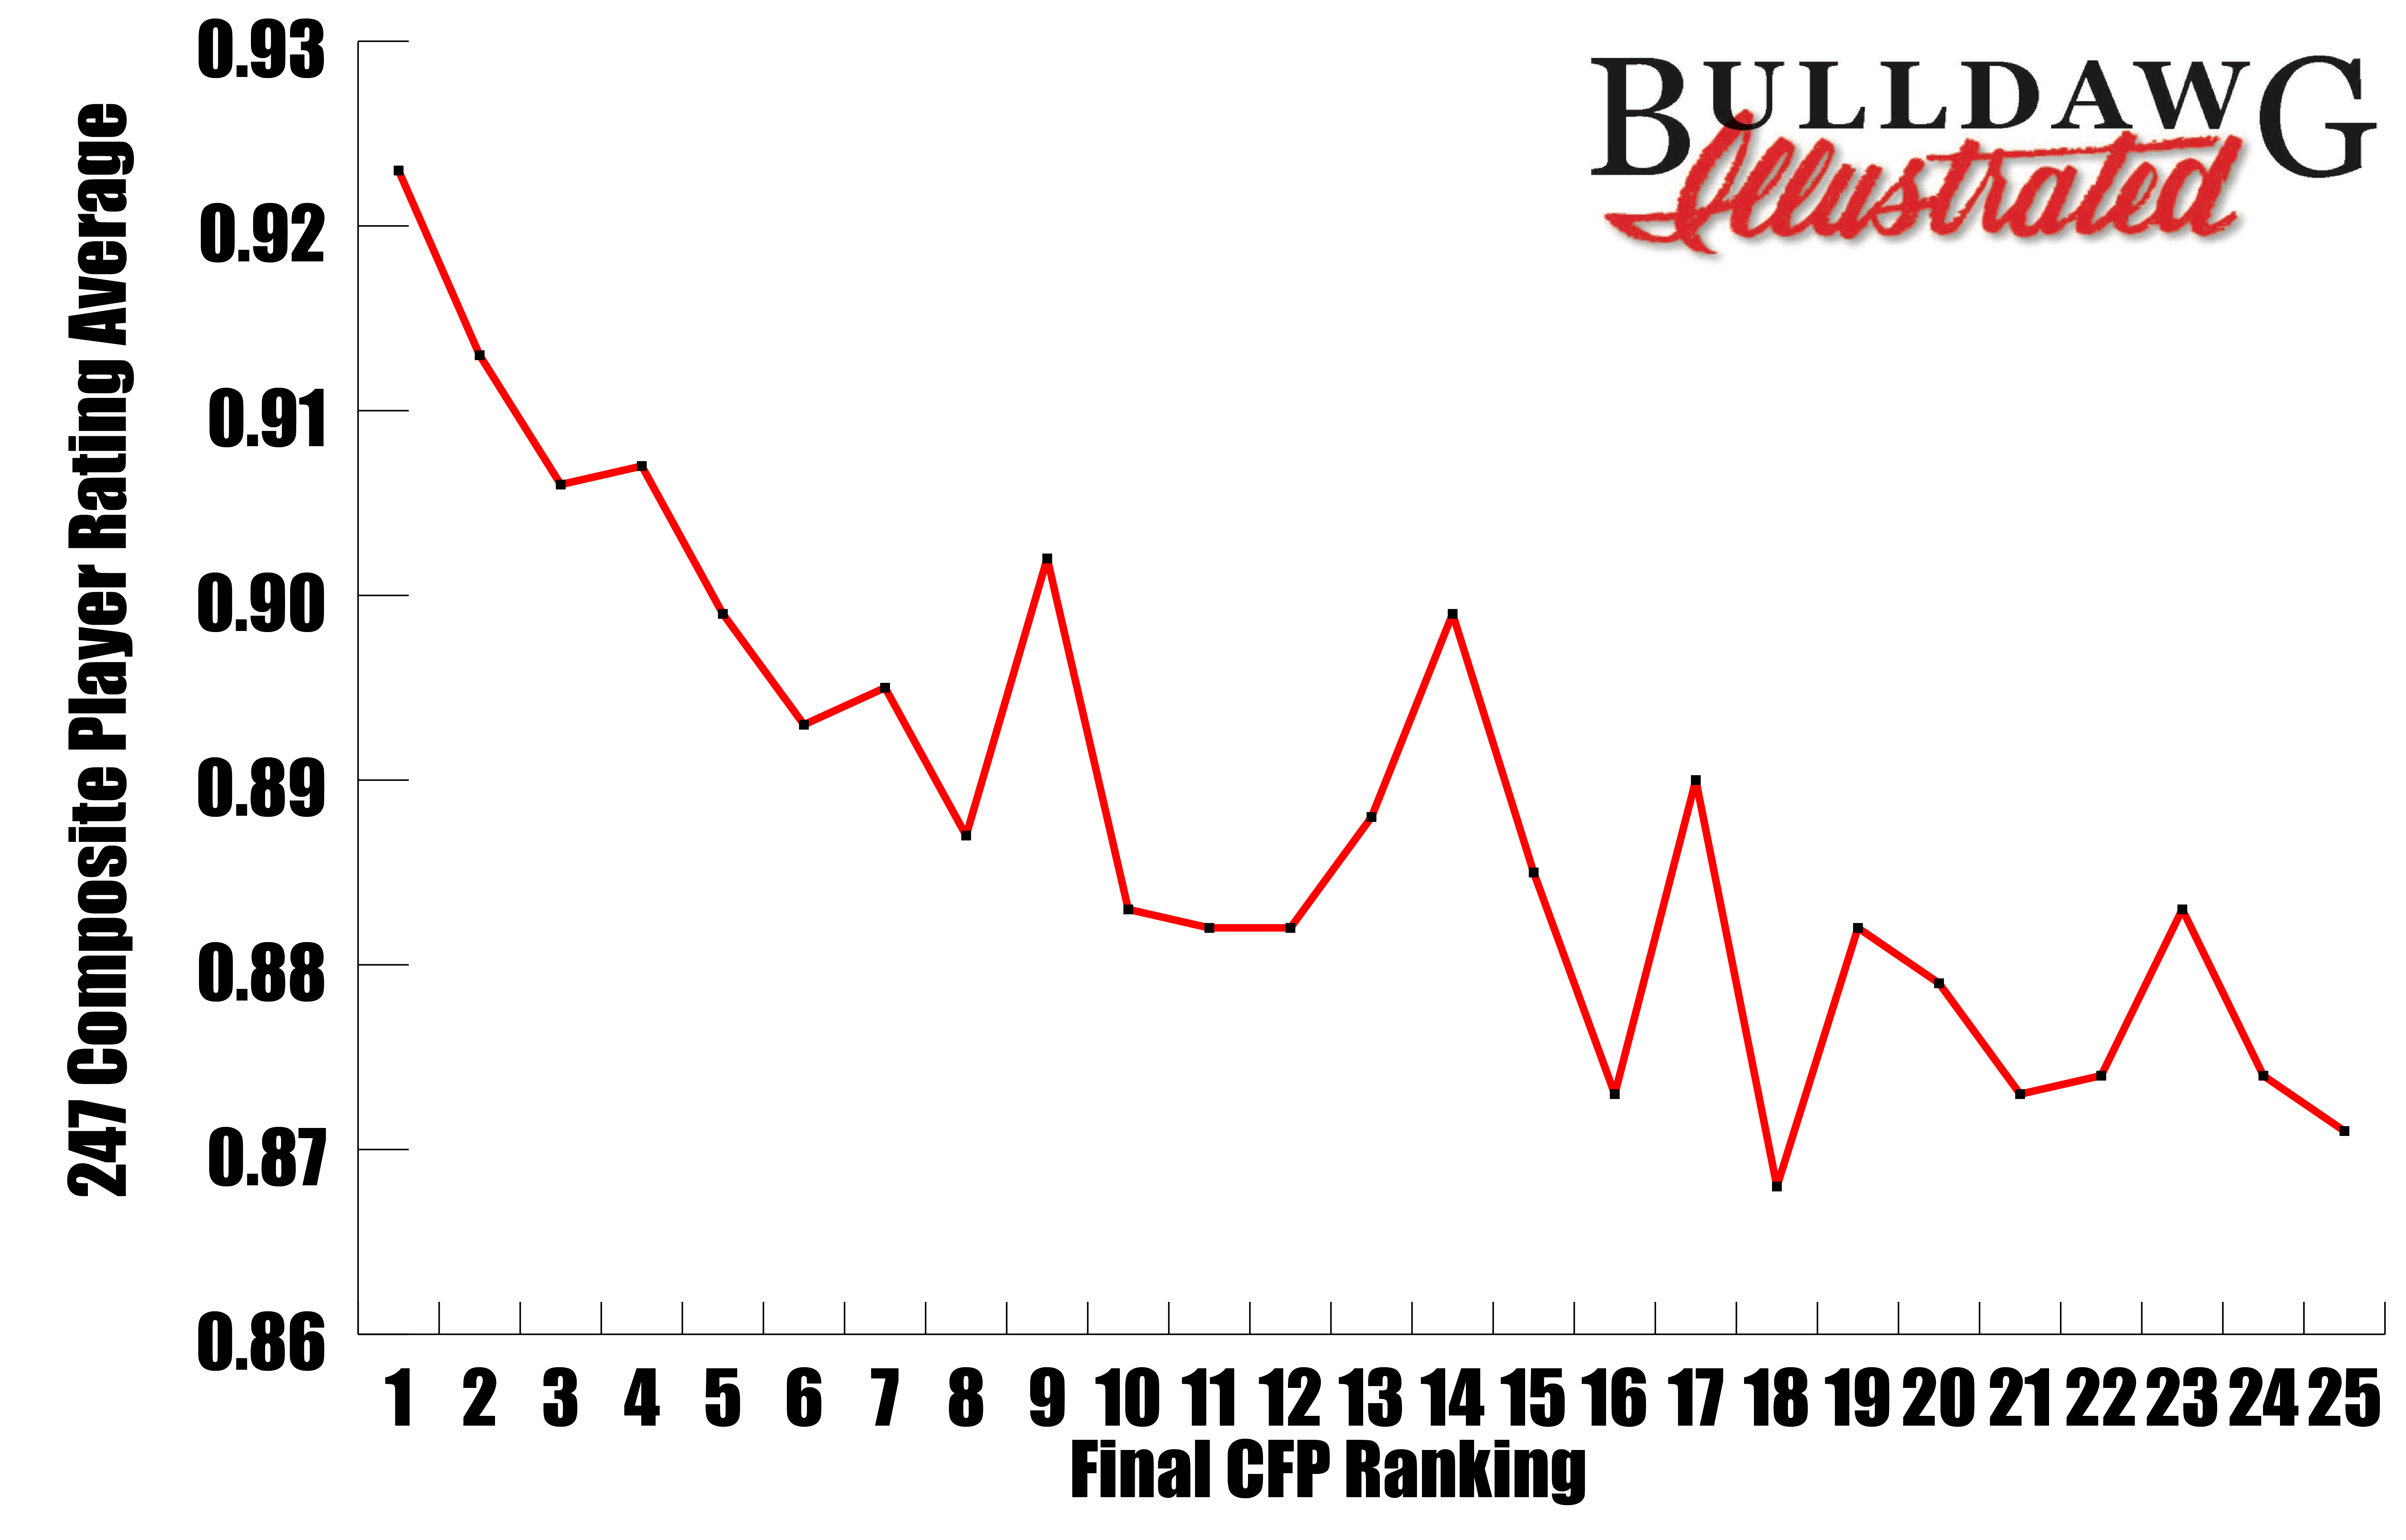
That’s pretty clear. It takes at least an average of .906 to get in the playoffs. Not quite that simple. Plenty of teams have had that average. Those USC teams I mentioned above had averages of .929 (finished 25th in 2015), .927 (finished 9th in 2016), and .925 (finished 24th in 2014). LSU has had some strong teams in 2015 and 2016. Both teams finished 20th and roster averages of .924 and .925 respectively. UGA had CFP talent in 2018 and 2019, but hard to point to 5th place as underachieving. Those rosters were .929 and .928 averages.
Let’s dig deeper on the above chart. This chart plots teams that over and underachieved based on this talent metric. Let’s take that .906 average (the lowest average for the 4 playoff spots) and plot teams that had equal talent and did not make the playoff. Also, this plots teams that made the playoff and were below that. 906 average.
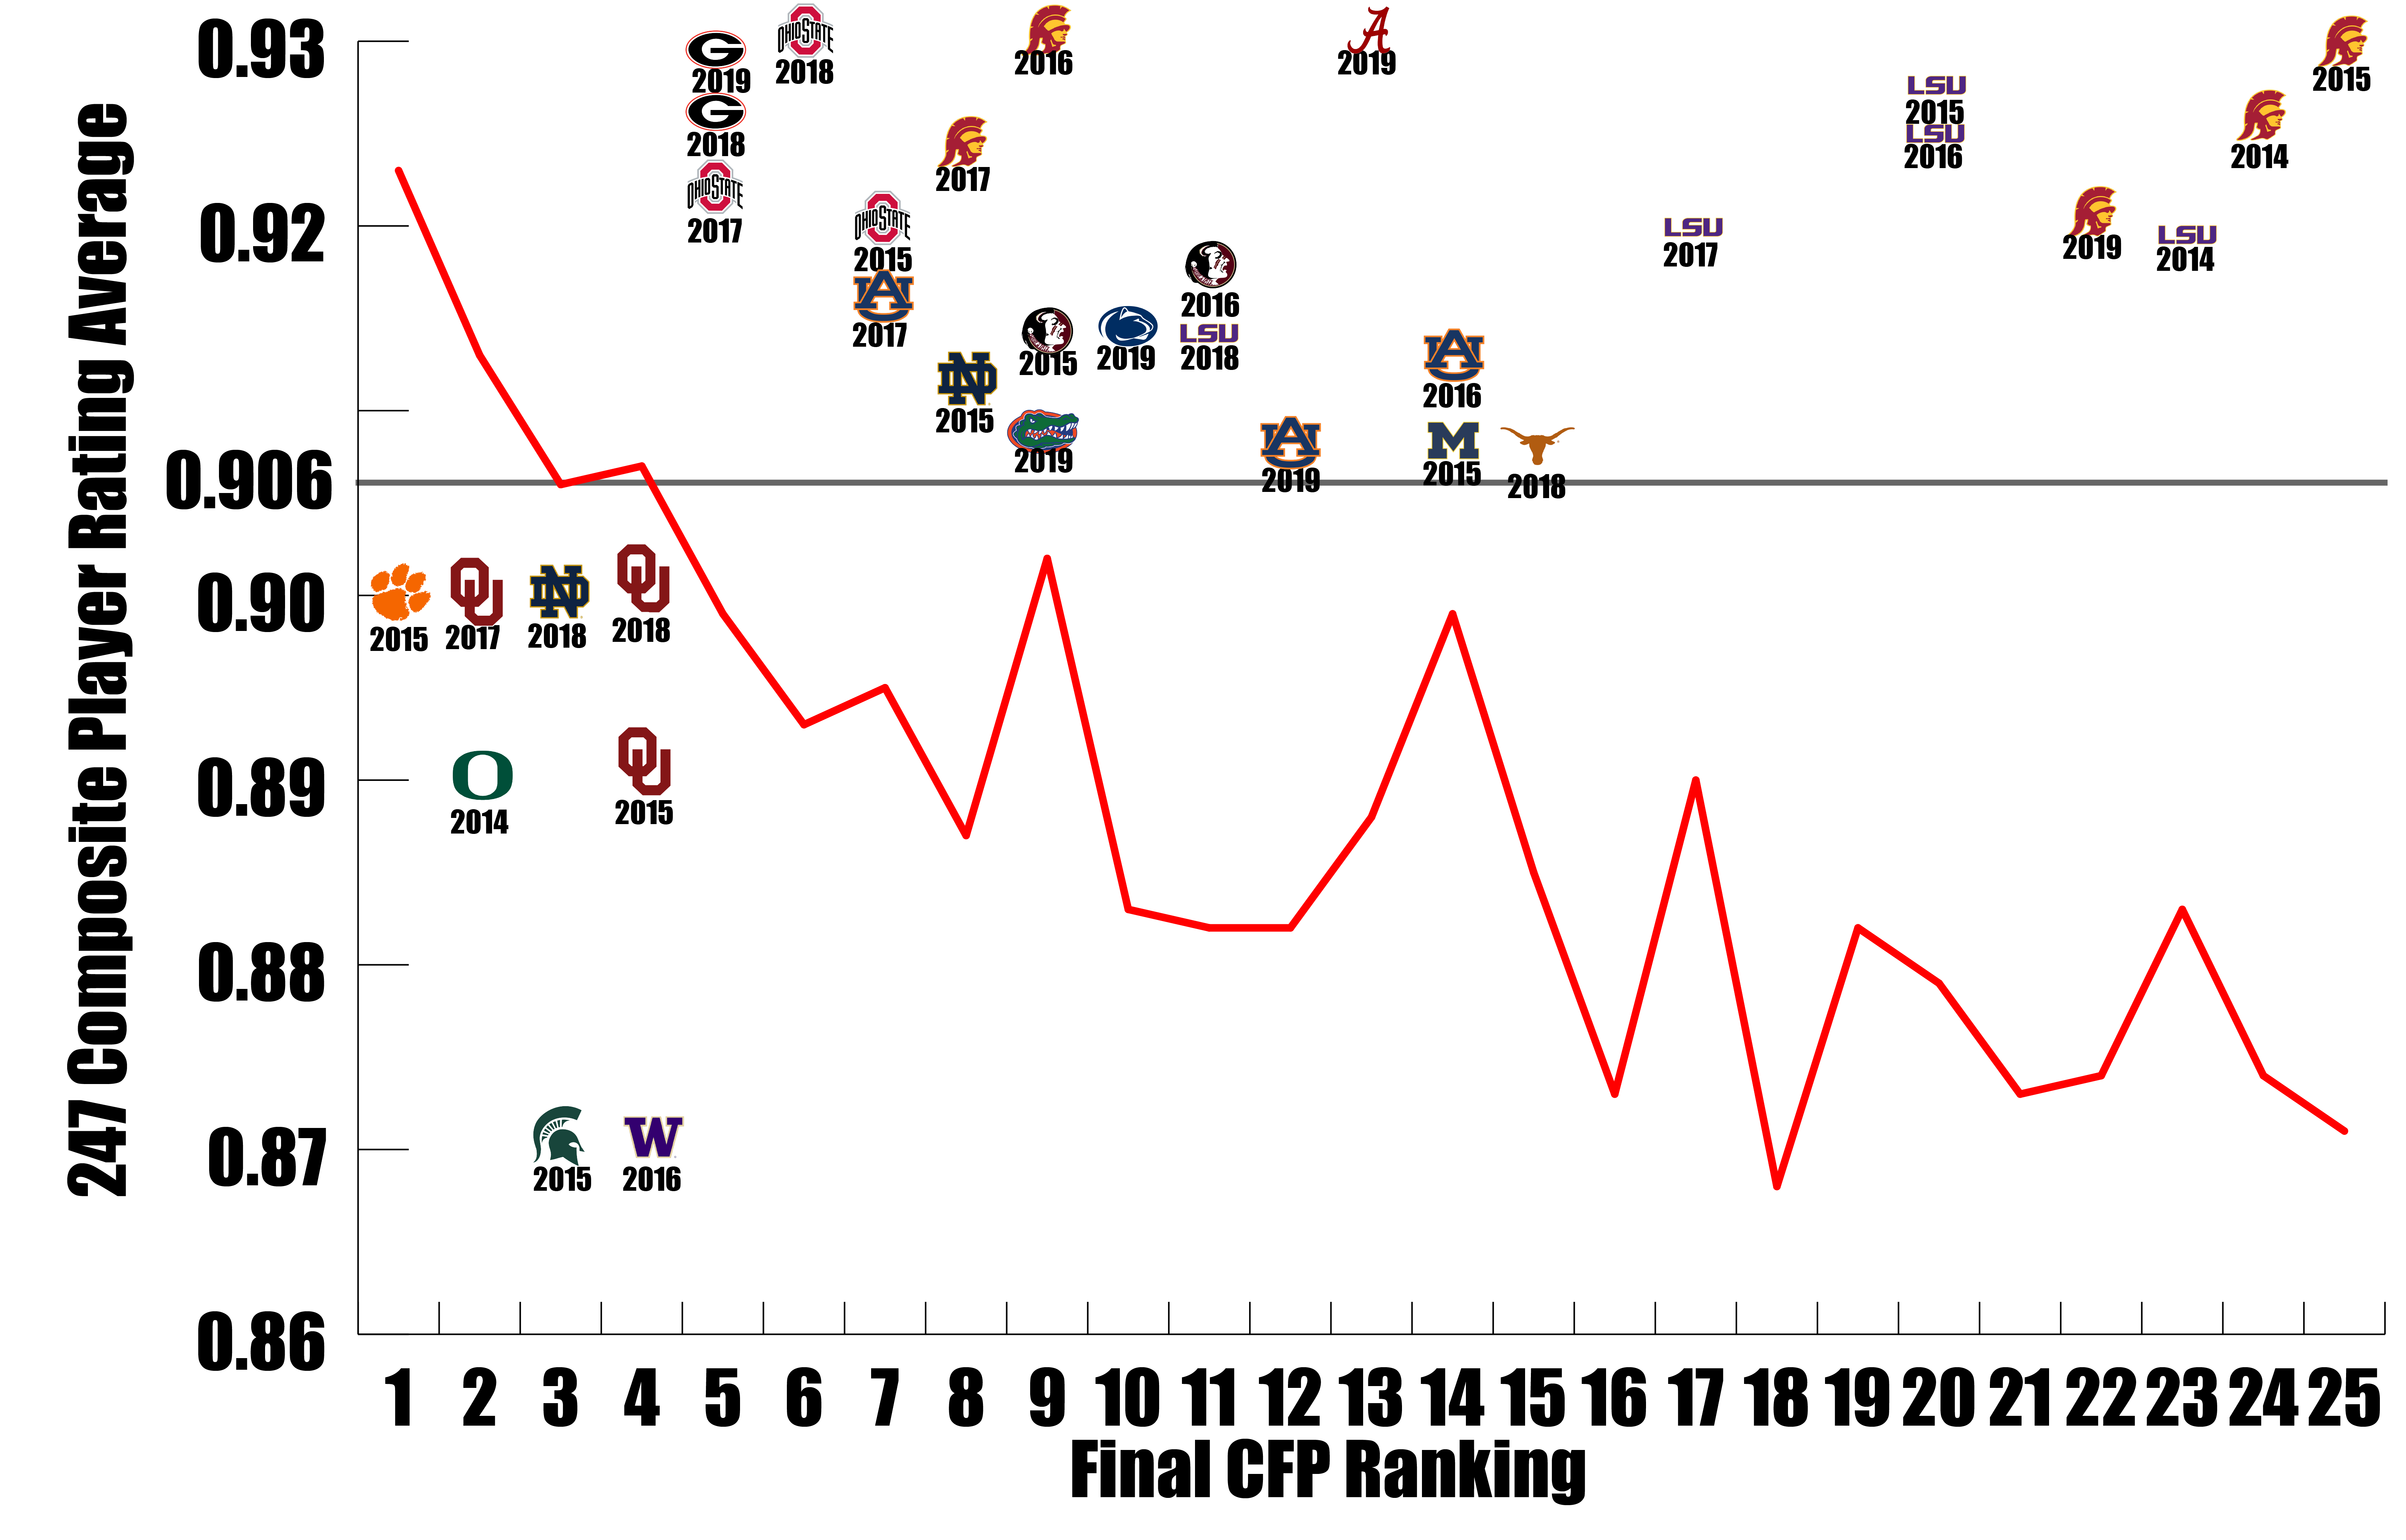
Again, this is the same line of “talent.” The gray line is the baseline of .906 247 Composite Average for the lowest team, on average, that made the Playoff. The teams plotted below this line are the teams that made the playoff with a player average of less than the .906 (overachievers). The teams above that .906 line are teams whose rosters’ average was higher than the lowest average Playoff team (underachievers) The higher the team’s logo – the higher that teams’ average was for that season (2019 Alabama had the highest average player .941 in the playoff era). 2016 Washington .870 was the lowest average team to make the playoff.
2015 MSU snuck in by defeating OSU which is also on this chart. 2014 Oregon and 2015 Clemson are the only “overachieving” teams to win playoff games. 2015 Clemson defeated the overachieving Sooners. Both Clemson and Oregon lost in the finals. 2017 Oklahoma showed that they were worthy of the committee’s selection in a little game called Rose Bowl. 2015 MSU, 2016 Washington, 2018 Notre Dame were not competitive in their playoff games.
The “underachievers” plotted on the chart have a more varied narrative. The 5th ranked teams clearly were the last ones out and probably don’t really deserve the “underachiever” label. 2018 and 2019 UGA lost in the SEC title game and were regarded highly by the committee. 2017 OSU probably has the toughest story, they won the B10 Championship game but were passed over by the committee for Alabama. 2015 OSU, had the talent average (.918) but lost to MSU (.872) in the B10 championship game. 2017 Auburn (.915) lost their last game (yeah, GO DAWGS) and beat 2 of the 4 teams in the playoff during the regular season. They also gave UCF their first self-declared title in the Peach Bowl… I digress (and I like trucks).
Back to the underachievers. The ones really worth noting are those higher on the chart. Aside from the 2019 Alabama team (.941) who the committee mis-ranked in my opinion, there are a lot of truly underachieving squads. Specifically, USC who has had Playoff quality rosters during the entire playoff era. USC has recruited at the Alabama and OSU level and never has really sniffed the playoff. Also, it’s worth noting that LSU has had the talent to be in the playoff every year – but their run this past season gets the monkey off their back. Our underachievers weren’t limited to ranked teams. Here’s a list of teams that were above our .906 Playoff Average that were not ranked in the committee’s final ranking.
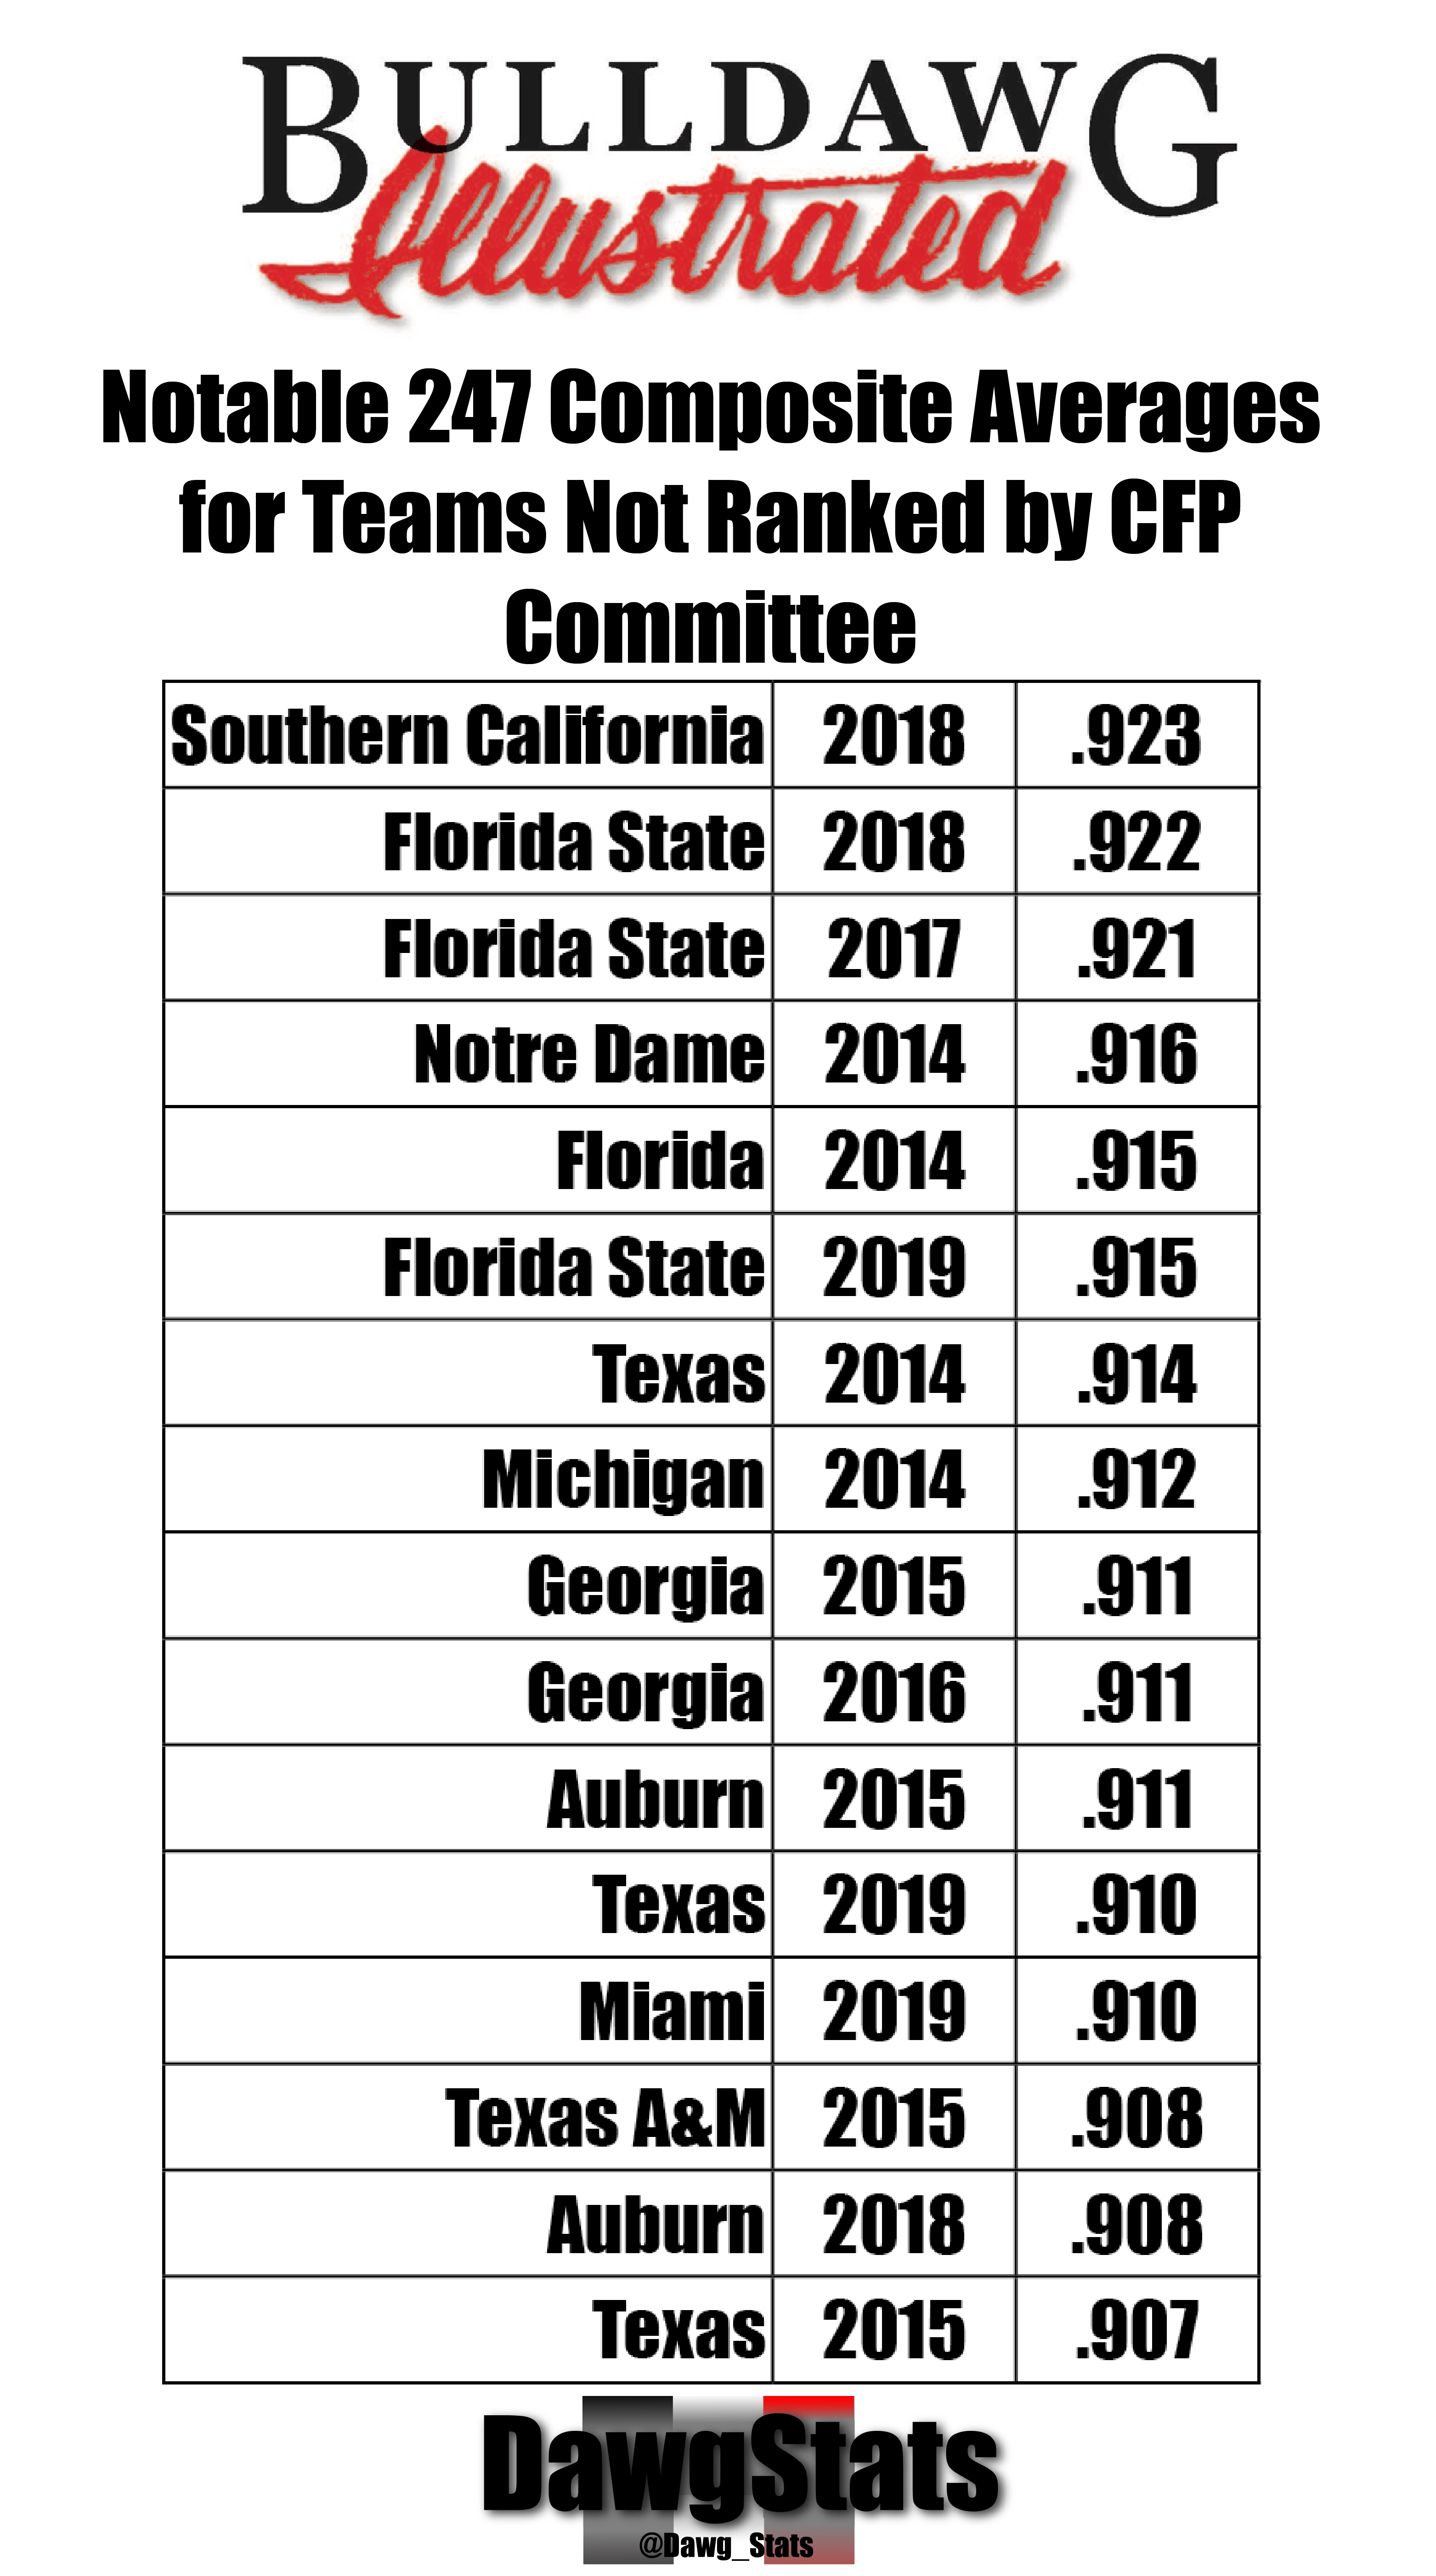
A couple of things as we wrap this post up. Look, there is USC again. I know that there a large contingent of folks that feel that UGA was underperforming given the brand and fertile recruiting area – but nothing by comparison to a USC whose talent and advantages appear to be rotting on the vine. LSU, had they not had it all come together this season, would be in a similar boat. FSU has the least excuses than anyone. The Seminoles have had much better classes than Clemson and little to nothing to show for it.
Next, I’ll look at the SEC with similar metrics. Be sure to leave me a comment if you have questions or comments. Happy to look up anything with what I’ve got. Go Dawgs!