
Using statistics or analytics to measure a game is one thing. But, using those metrics to predict is another. One unexpected, but exciting, thing about joining Bulldawg Illustrated is that I have to predict this week’s game. Which is cool. Really cool. So, I’ll use this post to look at some stats that show quite an edge for UGA as they travel north for their second SEC East tilt. My prediction will come later in the week. (I’m not gonna predict an upset)
Raw numbers certainly show that UGA is having a much better statistical season than Tennessee. A quick look at SEC Total Offense at CFB Stats.com shows that UGA is 3rd in SEC and UT is last. In scoring offense, UGA is 3rd with (42 PPG); while UT is 12th (26 PPG). Even on the defensive side of the ball, UGA has a significant statistical edge. Dawgs are allowing the second-fewest yards (262 YPG) and Volunteers sit at 8th in SEC (340 YPG).
But, scraping the play by play data and crunching it a layer or two deeper reveals even more. Success Rate (SR) is used in most, if not all, football modeling and ranking sites. SR tracks each play using down and distance to assign “success.” for each play.
Football Outsiders uses the following formula and I have used it in my spreadsheet.
Our Varsity Numbers column calculates Success Rate for teams, not just running backs, using a set of baselines that differ slightly from our NFL Success Rates: 50% of needed yards on first down, 70% of needed yards on second down, or 100% of needed yards on third or fourth down.
So, let’s look at UGA’s and UT’s SR
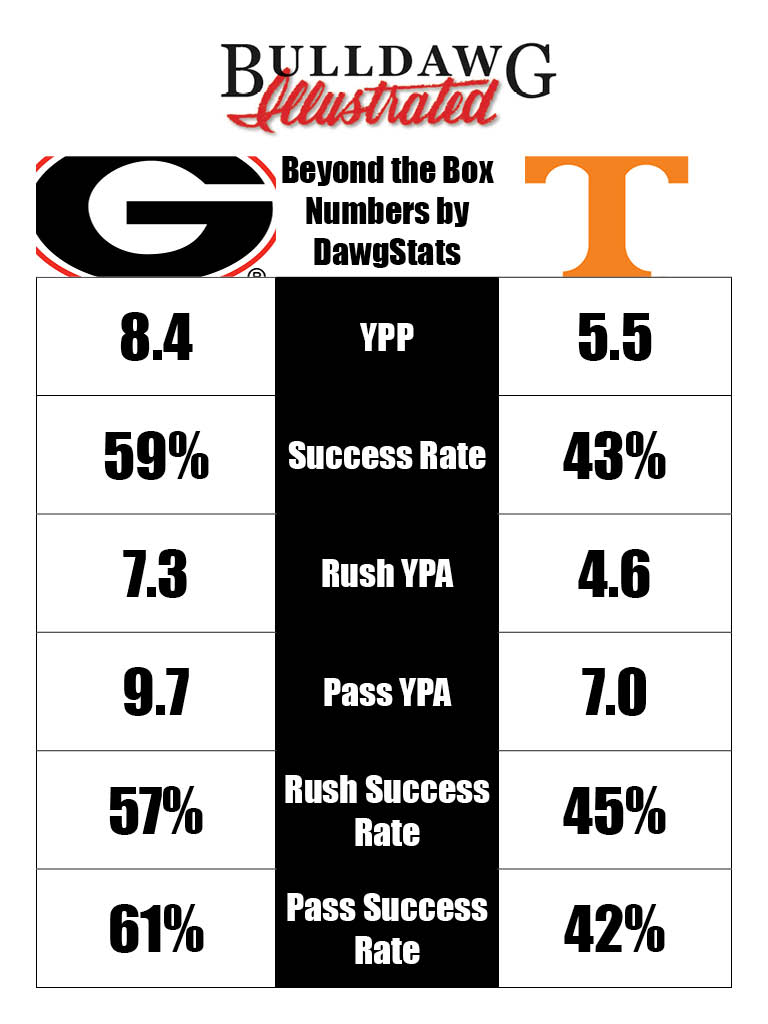
Those stats certainly don’t contradict “Box Score” numbers telling us that UGA is a better offensive team. Bill Connelly at ESPN says that teams that have a higher success rate win the efficiency battle and win 83% of games. If we break down SR by down, we see where UGA is putting it on defenses on early downs.
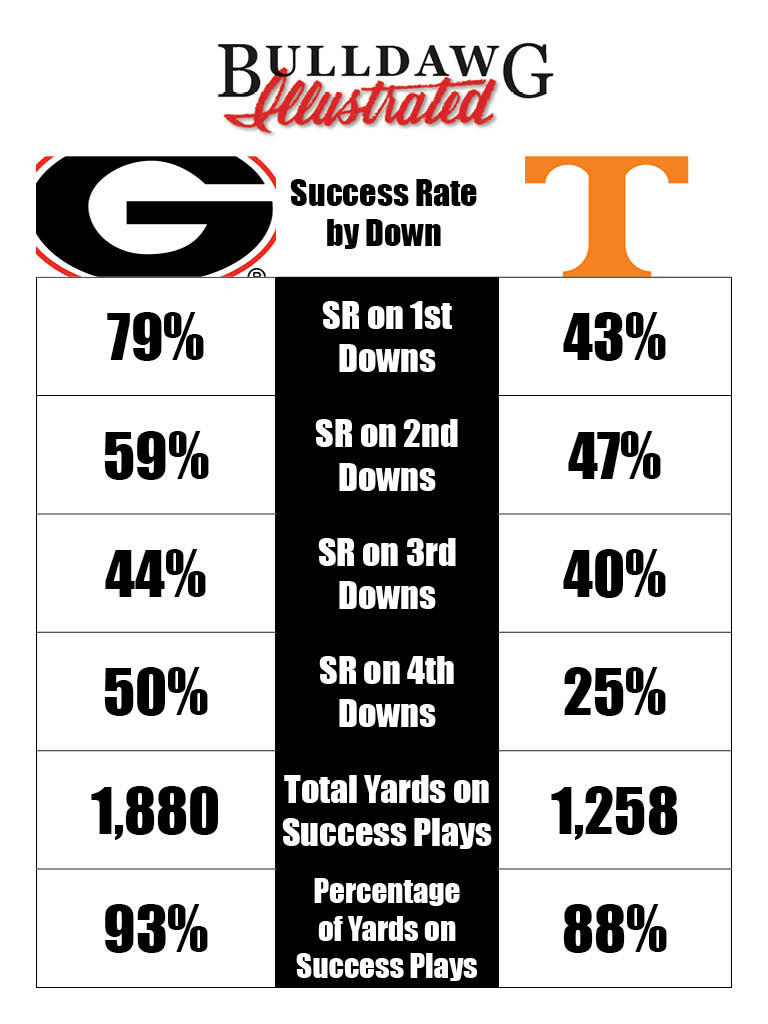
On third down, UGA does appear to regress toward the mean with a 44% SR, but still four points better than UT. UGA is simply incredible on 1st Down. (I am continuing to look at our personnel groups on first downs and will have another post on that soon)
Dawgs are running the ball on a high percentage on early downs, but, doing it more with 10 Personnel.
This puts four receivers in formation and blocking with 5 O-lineman. “Running the damn ball” out of this look clearly is creating mismatches and leading to wildly successful first downs.
This came across my feed today. Cole Cubelic interviewing Muschamp who likes to run it with 12 personnel. Not much to do with this post, just found it interesting
I am coming back later in the week with some more stats. Stay tuned and follow me on Bulldawg Illustrated and on Twitter @Dawg_Stats