
Gonna put a bow on all this. Thanks for reading. I hope looking at this series has taken your mind of everything going on. I also hope that, as Dawg fans, you see that UGA has put in place what it needs to do to compete for a National Championship… just got to finish it off.
This might be tedious, and I’m not going too deep analyzing the first part of this. But, I have to go through these metrics and pair them with actual performance. All this to head to a metric that, for me, puts a point on it.
As mentioned in my previous posts. I’ve collected recruiting data for rosters in the playoff era. I’ve made the case that it takes a roster that has average player rating of .906 to be a playoff contender. There were exceptions noted, but that .906 average is a strong indicator of playoff quality roster. Now, let’s attach some actual performance statistics to these averages.
Here are three graphs, but it’s really one graph introduced to you in three parts. Admittedly, it has some noise – but stay with me.
First chart is that same 247 Composite Player Average that was in my first post. But, I’ve added the unranked Power 5 Conference teams to them. Those unranked teams are sorted by talent average (underachievers). The most talented unraked team is comparable to that .906 average a playoff team. Keep in mind, that teams that recruit very well don’t always get ranked (USC, FSU, Texas, Michigan, Florida, and yes UGA contribute to this average). But, it’s still clear that the committee rankings reflect a downward trend in talent level.
.
Now, here is team Defensive Yards Per Play allowed. This one is probably is the least definitive of all the numbers I’ve been through. Still, the higher ranked teams give up fewer yards, on average.
Ok, noteworthy is that the #1 ranked team by the committee is allowing the fewest yards allowed on defense. Some noise in there as you see that the #8 team is, on average a very good defensive team. The #4 team is not much better defensively than the rest of the top 10 teams. Once you get past the #15 team, everyone allows over 5 yards per play. Since Coach Smart has taken over, the 2016 team was the only team to allow over 5 YPP defensively.
Defensive YPA in Playoff Era by CFP Ranking
- 4.650
- 4.817
- 4.910
- 5.172
- 5.047
- 5.073
- 5.103
- 5.200
- 4.837
- 5.045
Now, let’s lay in Offensive YPP.
Ok now we see downward trend in talent, with downward trend in Offensive YPA matched with upward trend in Defensive yards allowed. Also noteworthy is that #4 team that was allowing similar YPP on defense to the rest of the top 10 – skyrockets on Offense. Also noteworthy, where those squads that have strong Defensive YPA – they don’t match that on offense. (ahem, 2019 UGA anyone)
But, don’t lose fact that this Offensive YPP is a clear picture. Playoff teams average over 6.5 YPP on offense. The rest of team if football tend to fall off.
Now, one last line graph. Offensive YPP minus Defenisve YPA. This one is as clear the 247 Composite Average.
The playoff teams gain more than 1.5 yards per play than their defense allows… on average. 2015 Michigan State team drags this number down. If Ohio State had won and made playoff – the average jumps to 1.8.
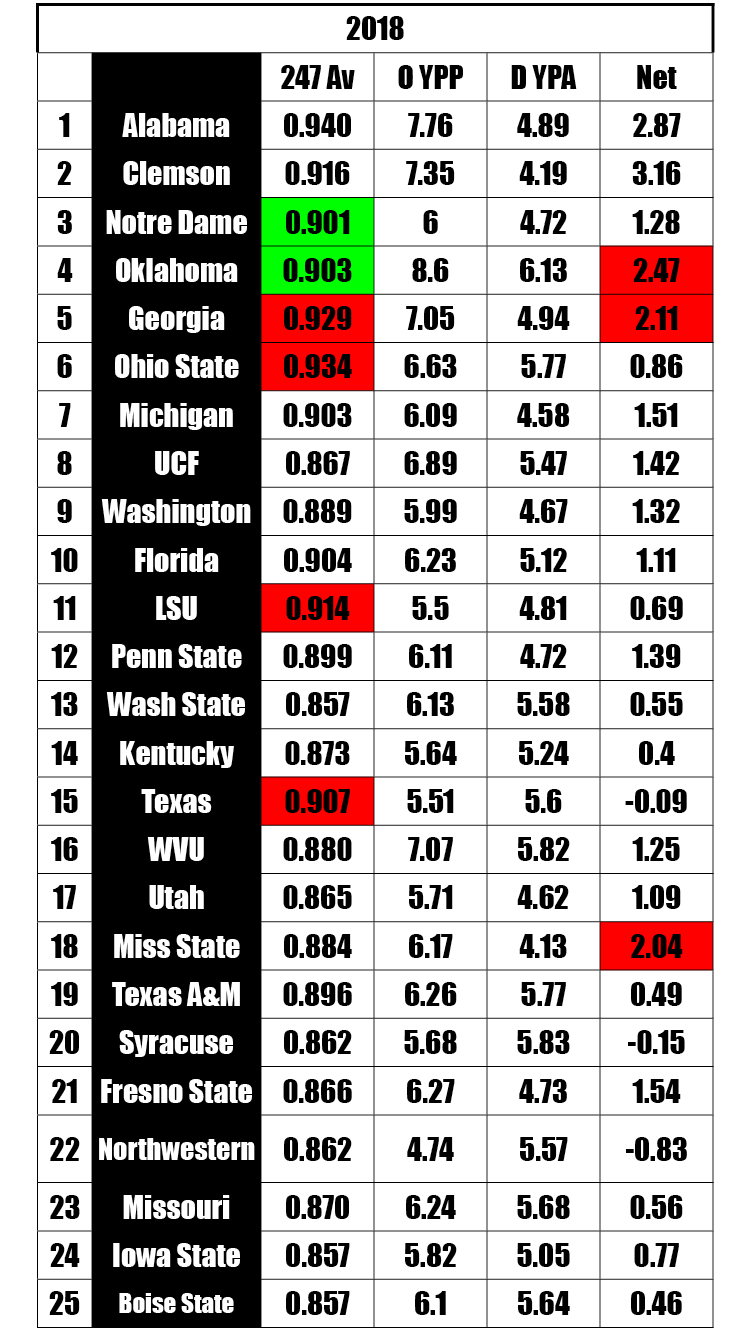
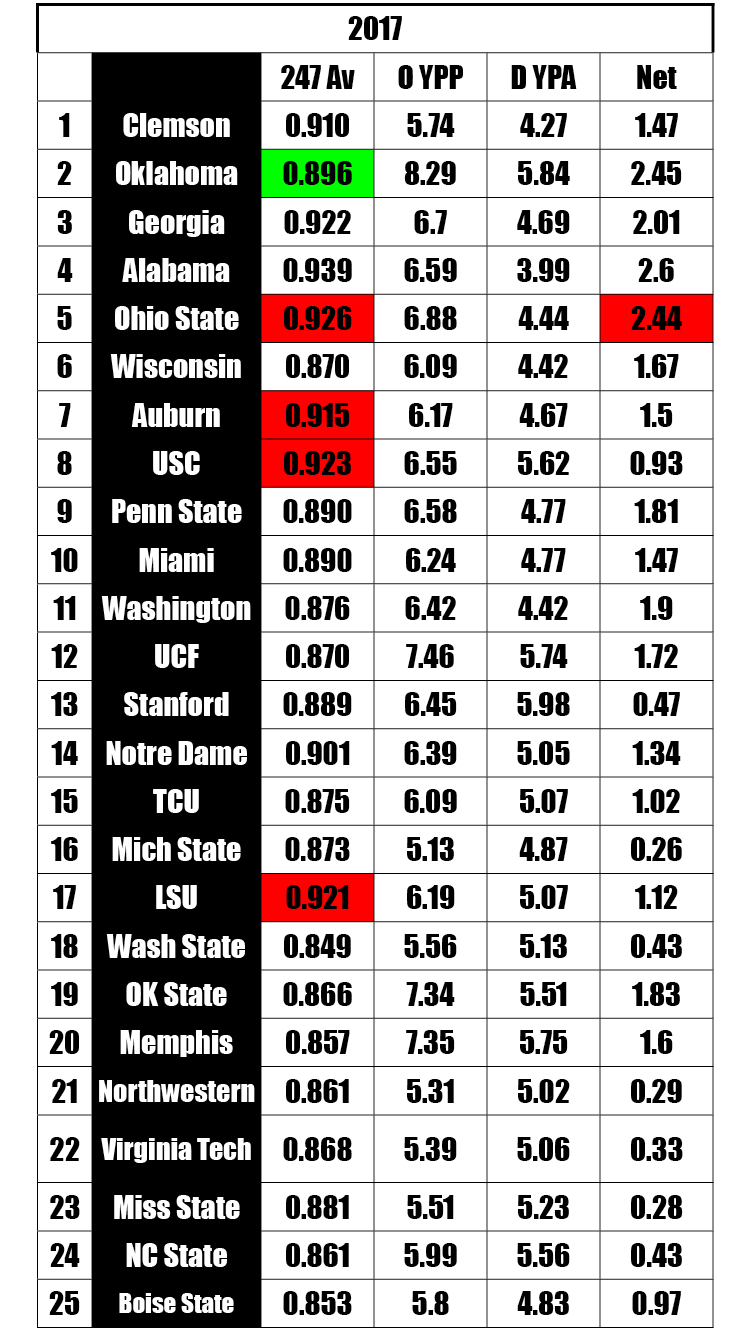
A number that is even more significant is 2.0 YPP differential. The only teams in the last 3 playoffs that had a differential less than 2 yards was 2018 Notre Dame (1.3) and 2017 Clemson (1.5) … coughs… UGA’s differential was 2.1 that season.
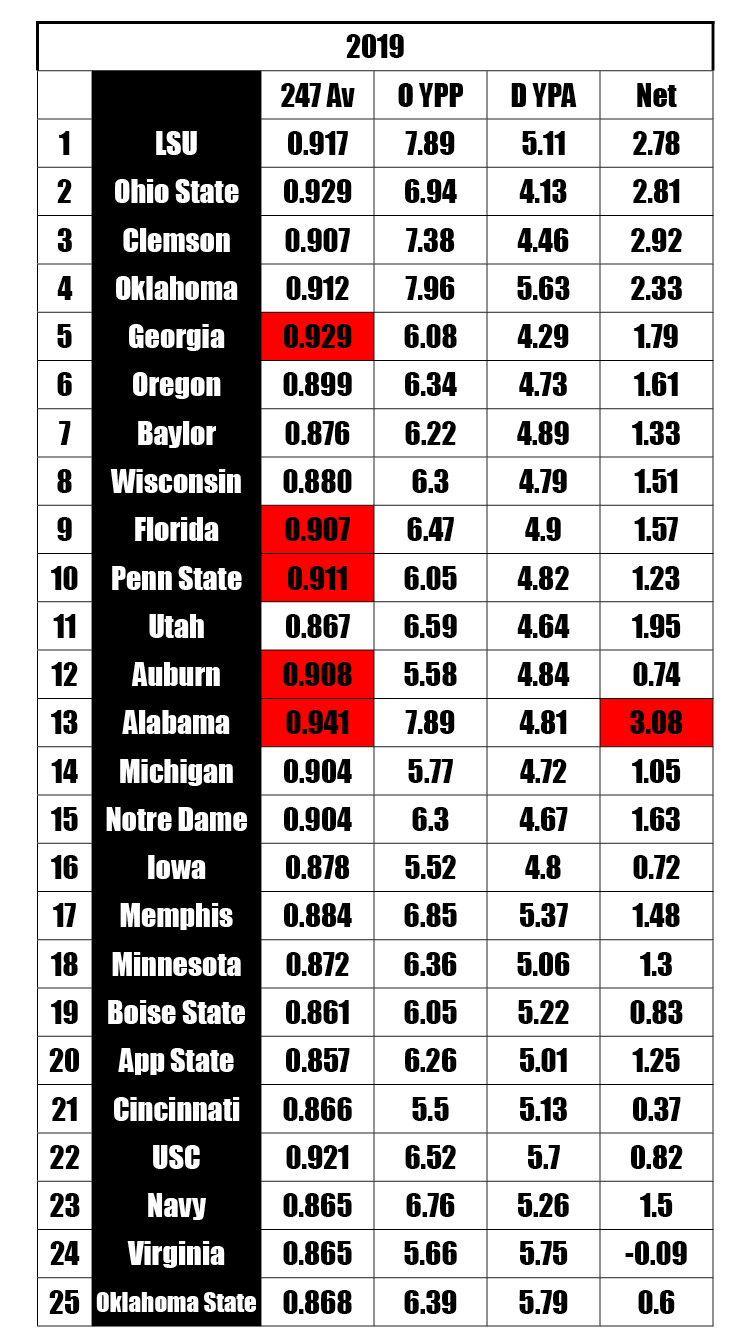
In fact, in the entire playoff era only 7 teams eclipsed the 2 yard differential and did not make playoffs
- 2019 Alabama (3.1)
- 2018 Mississippi State (2.0)
- 2017 Ohio State (2.4)
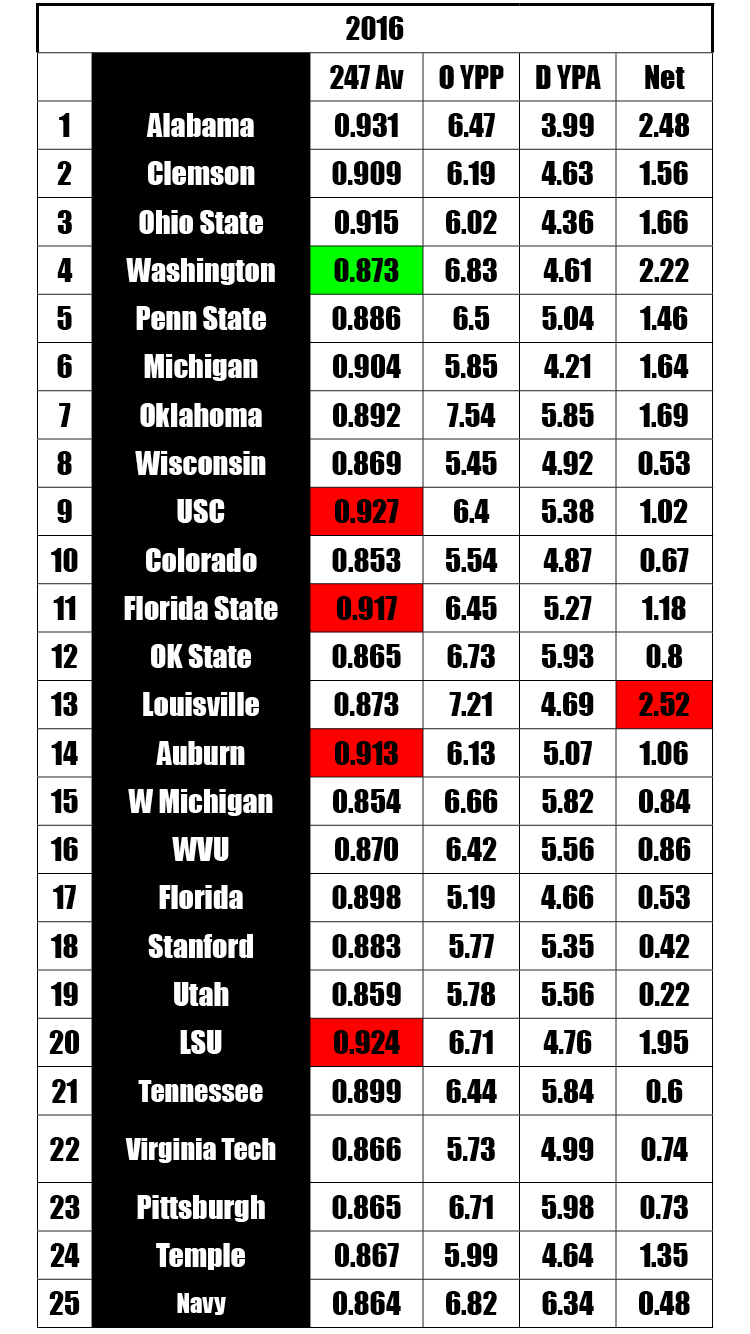
- 2016 Louisville (2.5)
- 2015 Ole Miss (2.2)
- 2015 Baylor (2.1)
- 2014 TCU (2.0)
Ok, I fibbed. This last graph is a bit of graphic design hocus pocus. It’s the same YPP differential with the 247 Composite Average pasted on top to scale of the Offensive YPA/Defensive YPA net.
Same chart, with scale 247 Composite average pasted on top…. It takes talent to produce results that will earn a playoff spot.. UGA has the right guy for the job. Coach Smart is a relentless recruiter and administration has bought in on his vision to go all out assembling talent. Go Dawgs!!
Scroll down to see some raw data. Thanks for reading.